In my last article, there was a theory-driven discussion on animal shelter analytics. The article focused on the need for analytics at shelters, the challenges and possible solutions to these challenges. One of the main challenges of analyzing data at the shelter was the reduced quality of data collected. In this post, I intend to shed light on the data quality problems at the shelter and how I dealt with them.
The data says “Hi! Nice to meet you!”
The data collected at the shelter had about 9-13 columns - I can’t exactly localize it as the number of columns varied every year as the shelter began adding more important columns. The data I received was data about animals at the shelter, collected over a 5 year period, roughly about 15,000 records. The data recorded several details of the rescue, some of which were
- What was the rescued animal’s common name?
- What species was the rescued animal?
- When was the rescue performed?
- Where was the animal rescued from?
- Who was the informant?
Now, this was a gold mine. I had 15,000 rows of data on animal rescues. This was the first time I was working on a real-world challenge and my work with this data could literally make a difference.
Okay, you know this is coming. So, let me just get on with it - The data soon morphed into something that was wicked and was determined to suck out the very last drop of patience in me. Soon, I was confounded by some very real-world problems!
Playing matchmaker for the data
To start of, the data was internally fragmented. There were 5 different excel files for each year and each file had 12 separate sheets for each month. I had never dealt with anything other than a beautifully combined .csv file as a part of my undergraduate coursework.
Luckily, my online learning had taught me pandas groupby() which seemed like a good choice. But, how to combine sheets within an excel file? And I had to combine 60 sheets of data together. I had to play matchmaker for the data.
Fortunately, a quick google search helped me find my guide. Problem solved! That was simple. I ran of to party.
Accepting that data is not perfect
When I returned to work the next day, I had a simple agenda - run some summary stats over my data and let my coordinator in on some of my finds, which would(most likely) impress the team. I first ran a count of the most rescued species. These were the top 5 most rescued species in the last 5 years at the shelter.
| Species |
|---|
| Spectacled Cobra |
| Spectacled cobra |
| Spectacld cobra |
| Spectacld Cobra |
| Spectacle cobra |

I asked my mom if she had a rope in the house. She didn’t. And here I am, writing this article.
After a few days of crying, I got back to work. I opened the excel files (original source of data) and had a look over the data. It is magical how this kind of manual inspection can help understand some of the most pressing problems in the data. My inspection led me to discover the following problems in the data
- Missing values
- Spelling errors
- Case errors
- Scientific name confusions
- Irregular date formats
Now, the reason why these were “problems” and not mere phenomenon to be overlooked is because analysis performed on data with problems is worse than analysis not performed at all. In the context of the animal shelter, if I provided the team with numbers obtained from inconsistent data, there could be some very serious issues from a strategical and decision-making point of view.
I now had in hand the task of cleaning up the data. Quick detour, I recognize that almost every “Data science for beginners” article talks about data cleaning to be limited to the first step in that flowchart people like drawing. I think its more than that. Data cleaning might just be infused into the entire process. Data cleaning need not be confined to dealing with missing values or for that matter, problems with the data. Its more about representing the data we have into a form more suitable for the task at hand.
Coming back, how did I clean the data then?
Making the data “better”
There are no universal ways to clean data. However, there are some steps that are common to different data cleansing journeys. These steps can be discovered on the internet with great ease. In the data I had, cleaning operations falling into this category included
1. Dealing with missing values
Of the several different strategies available, omission is generally considered a poor one because it leads to data loss. In my case, omitting a few records were necessary as some of them lacked important details such as the date of rescue. But, this proportion was very little.
2. Unifying date formats
The dates of rescues were encoded as string in some sheets and date in others. A quick brush up through date handling in pandas helped rectify these issues.
Handling inconsistencies in names
But, these were just the tip of the iceberg. The real problem was the issues in naming and spelling errors. When confronted by such challenges, I believe there are 2 main ways we tend to follow:
- Approach 1 or the Manual way - The idea is to manually rectify the issues
- Approach 2 or the Automate way - Write some code to diagnose data issues and clean it
In the context of the shelter data, going manual meant find and replace all names that were misspelt with the correct spelling. Fun, isn’t it? The automate way would require me to write a super-intelligent program to do it all. Well, I was clearly out of my depth here then :)
The manual way will ensure greater control over the cleaning, while the automated way will require me to trade control for speed.
So, what did I really do? Well, I chose the path that most people choose when confounded with a choice between 2 options that lie at extreme ends - I created a 3rd option having best of both worlds! Calling it the Hybrid variant, I decided to write a script that would clean the data in a semi-automated fashion, with my intervention.
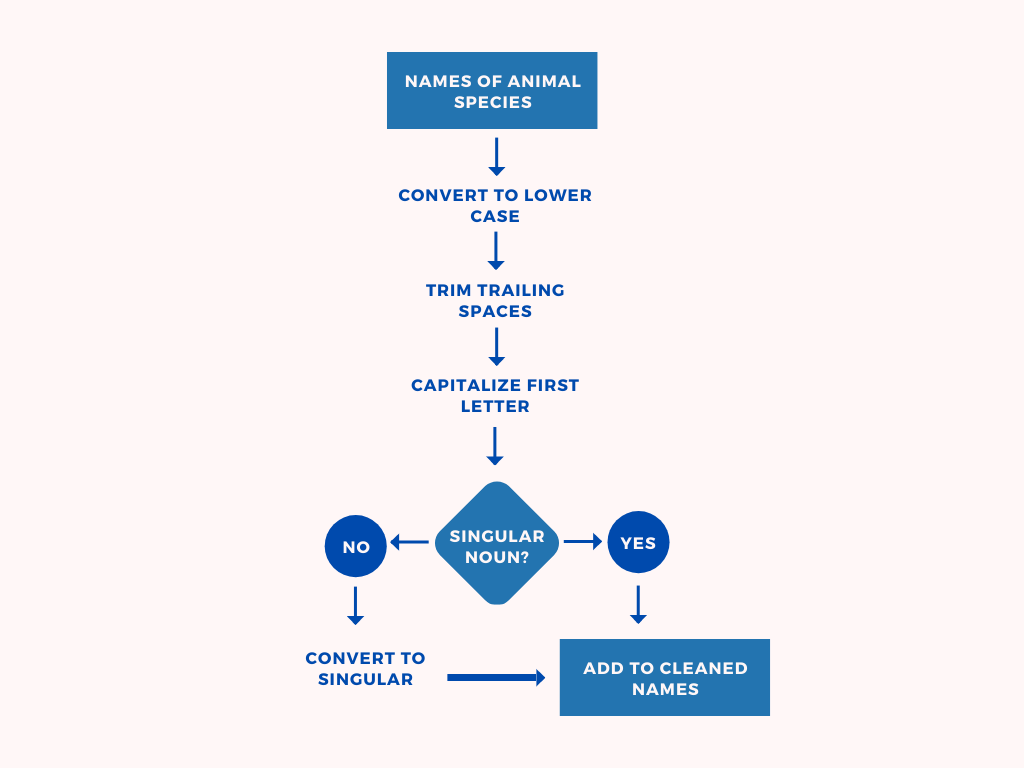
First, the names were first sent in through a preliminary cleaning pipeline. This is described in figure 1.

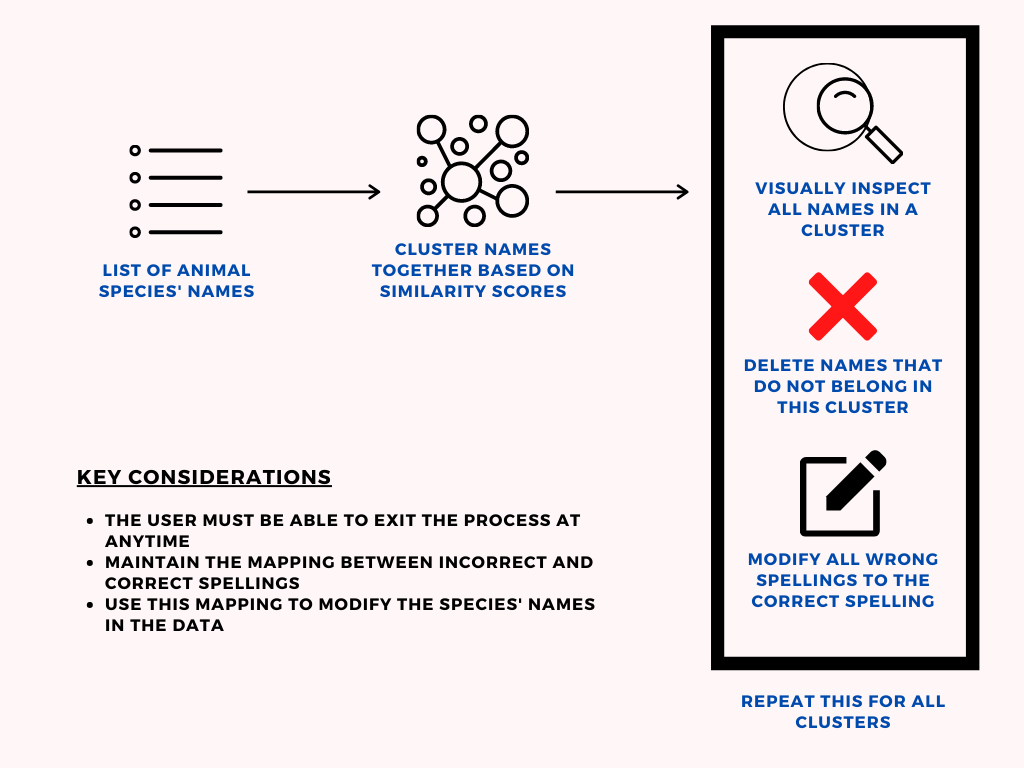
The idea of the hybrid approach was simple → Use similarity scores to cluster animal/species names that were closely related. Display the cluster as output, inspect it and delete entries that do not belong to the cluster. Repeat this process till some stopping criterion has been achieved.
This hybrid approach is explained as a graphic in figure 2.

In order to identify the correct spelling of an animal, I googled the spelling. In hindsight, I could have maybe automated that part too and reduced the manual load even more.
Before getting the data from the past 5 years, I was first given data from the last year of operations at the shelter. I performed cleaning of this initial data using the manual approach. It took me about ~10 hours (with breaks so that I didn’t go mad) to perform this cleaning. Building this useful script helped me clean up inconsistencies in naming with much less hassle and the whole process took around 2 hours only!
Woohoo! I had finally “purified” my data. But, does responsibility end with cleaning the data alone?
Preparing for the future
“Clean the data once, you are a good person. Ensure it never gets messy in the future, you are a hero.”
The shelter obviously benefited from the analysis I provided them after my data cleaning operations. However, it was important to communicate to the shelter the issues its existing data cleaning practices had. Doing so will help the stakeholders look towards the future and be prepared to surf on the waves of data-driven decision making!
When I decided to communicate these data issues to the team, 3 tips I got from some of my insightful conversations with my father were
- Speak the truth
- Don’t act as a “know it all” as you have no idea how difficult data collection can be
- Be a part of the solution, don’t just describe the problems and leave
It ended up with me submitting a separate report with the help of my coordinator at the shelter about how the shelter could use its data more effectively to make decisions, with a detailed focus on how to solve some of their data collection and quality challenges.
In all fairness, none of this would have been possible if not for the shelter’s team being extremely accommodating and result-driven.